Gallery
Comics
Animation
Info
Comments
[EDIT]
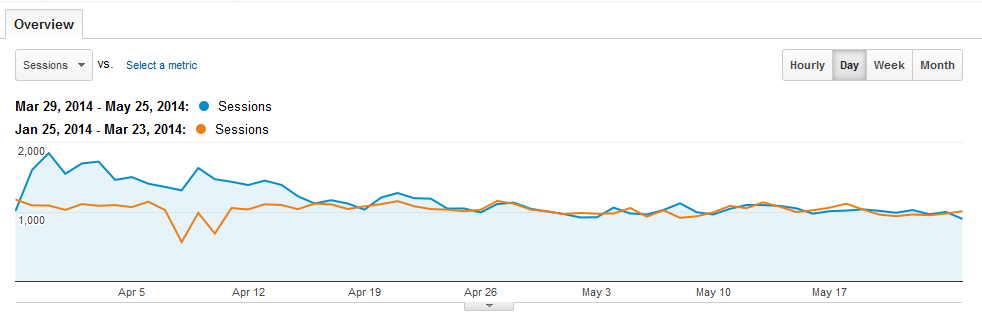
A graph comparing daily site sessions before hentai foundry (orange) and after (blue).
Comments
Posting...
Javascript Required.